Evolution involves random events, including new mutations, and natural selection, which favors fitter variants over others.
When is evolution predictable? For fast-evolving viruses, limited predictability emerges from three key factors. First, because mutation rates are high, the population continuously produces new variants, some of which have a fitness advantage. Second, selection between variants is strong, so fitter variants spread rapidly. Third, important selection components are computable from past data, notably the immunity in the human population induced by previous variants.
Evolutionary predictions are concerned with genetic changes of a virus, their effects on viral functions and fitness, and the resulting shifts in the population of circulating viruses. Evolutionary predictions are different from epidemiological predictions, which are estimates of future case numbers.
Current predictive methods span periods of about one year into the future. Recent approaches also predict key properties of new viral variants even before they are observed.
Predictive analysis can be extended to estimate how the viral population responds to human interventions. In this way, it can inform vaccination strategies that are effective against future variants. For more details, see selected publications [1,2,6,7].
Importantly, predictive analysis estimates the probability of future evolutionary trajectories but does not give certainty. Model-based predictions are limited by noisy and incomplete input data, fitness effects not included in the model, and the intrinsic stochasticity of evolution (e.g., the emergence and effects of new mutations).

Our comprehensive methods combine world-wide genetic, epidemiological, and molecular data.
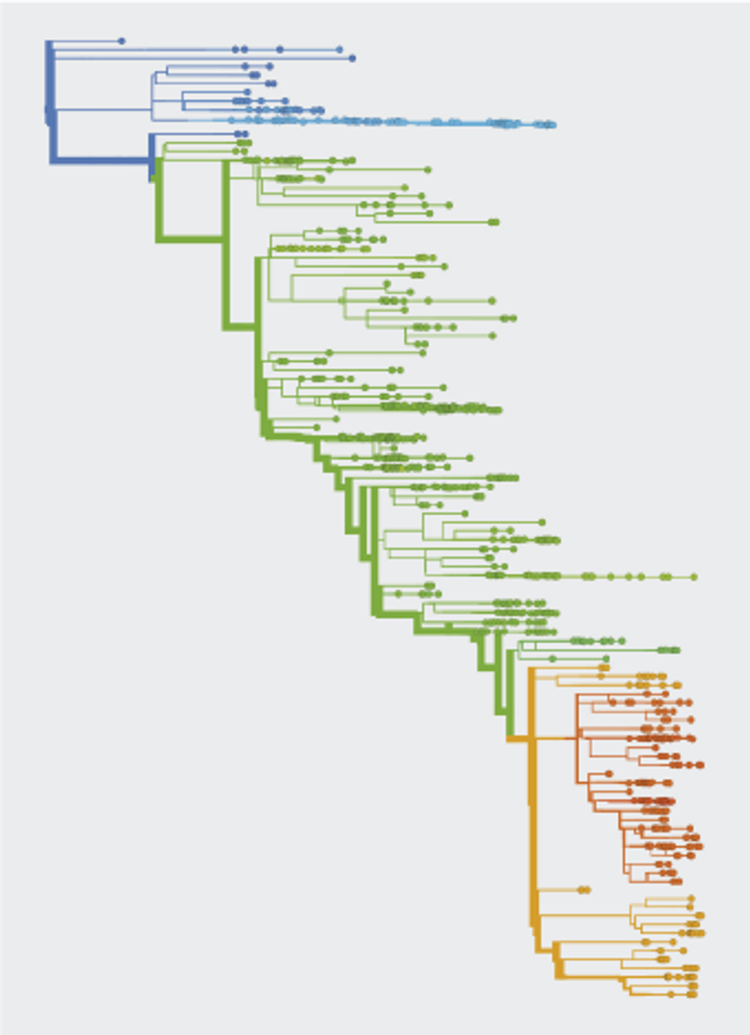
Sampling of viral isolates provides genome sequences of circulating strains, resolved by time and region of collection. Sequence data serves to estimate the frequencies of variants and to build evolutionary trees of the virus.
Epidemiological data, including case numbers of infections and vaccinations, enter estimates of immunity present in the human population.
Molecular experiments provide information relevant for viral fitness, notably the neutralization of viruses by human immune antisera and by monoclonal antibodies.
All data sources of our predictive analysis are listed here.
Human cohorts. Each human has a unique immunological history with regard to respiratory diseases. Understanding the collective evolutionary pressure exerted by the human population is key to predict viral evolution. At Previr, we have access to several cohorts and biobanks established at the University Hospital of Cologne or within cross-center cooperation projects. These cover a diverse population with a variety of virus-host interactions and can be harvested for predictions. We characterize the humoral immune response within cohorts to learn about commonalities and variation of response patterns between individuals.
Monoclonal antibodies. A major part of our experimental research deals with the analysis of monoclonal antibodies. We perform genotypic and phenotypic characterization in the context of natural infection and vaccination. To this end, we have developed high-throughput protocols to isolate hundreds of monoclonal antibodies from an individual. A network of international collaboration partners provides expertise in structural and further functional analysis of monoclonal antibodies. For more details, see selected publications [3,4,5].
Our predictions are based on strain- and variant-specific models for viral fitness. Fitness differences between co-circulating variants are used to compute likely future changes in their frequencies. We use a fitness model of the basic form
\[
f_\alpha (t)= f_{\rm{int},\alpha}-\sum_\kappa c_{\alpha \kappa} r_\kappa (t).
\]
This model computes the growth rate \(f_\alpha(t) \), or absolute fitness, of a given variant \(\alpha\) at a given time \(t\). The first term \(f_{\rm{int},\alpha}\) is the intrinsic fitness component, which is related to the basic reproductive number. Viral traits relevant for intrinsic fitness include protein fold stability and binding to human cell receptors. The second term is the antigenic fitness component. This term measures the selection pressure induced by immunity of the human population, which in turn is generated by previous infections and vaccinations. Here \(c_{\alpha\kappa}\) is the amount of immunity against variant \(\alpha\) in humans with a given infection/vaccination history \(\kappa\) as estimated from neutralization data, and \(r_\kappa(t)\) is the fraction of humans in group \(\kappa\) at time \(t\). This form can be generalized to include immune waning. More details are given in selected publications [1,6,7].

Previr uses a comprehensive computational pipeline for integrative processing of sequence data, epidemiological data, and neutralization data for a given pathogen. This pipeline is continuously updated to new research questions and public health demands. Our analysis has the following steps.
Data curation of viral sequences. This step filters out low-quality or incomplete isolate sequences.
We first truncate the 3’ and 5’ regions (specific to SARS-CoV-2) sequences and prune all sequences with > 1% ambiguous characters or an incomplete collection date. Quality filtering is run a second time after alignment. From the remaining set, we sample unique sequences sorted by collection date that are within the 95%-quantile of divergence for sequences for a given month.
Sequence alignment. This step maps nucleotide substitutions along the genome between all sequences of the data set.
The sequences of each pathogen are aligned with MAFFT v7.505 (Katoh & Standley, Mol Biol Evol, 2013) to a reference isolate from GenBank.
Reconstruction of the strain tree. This step builds a family tree for all isolates of the data set based on their sequence similarity.
We obtain maximum-likelihood trees from aligned strain sequences, using IQ-Tree2 (Minh et al., Mol Biol Evol 2020). We select the best fitting model for topology reconstruction by running ModelTest implemented in IQ-Tree2. Each observed viral isolate is mapped to an external node of the tree, which is timed by collection date of the isolate. The maximum-likelihood timing of internal nodes and inference of ancestral sequences and mutations is performed with TreeTime (Sagulenko et al., Virus Evol 2018).
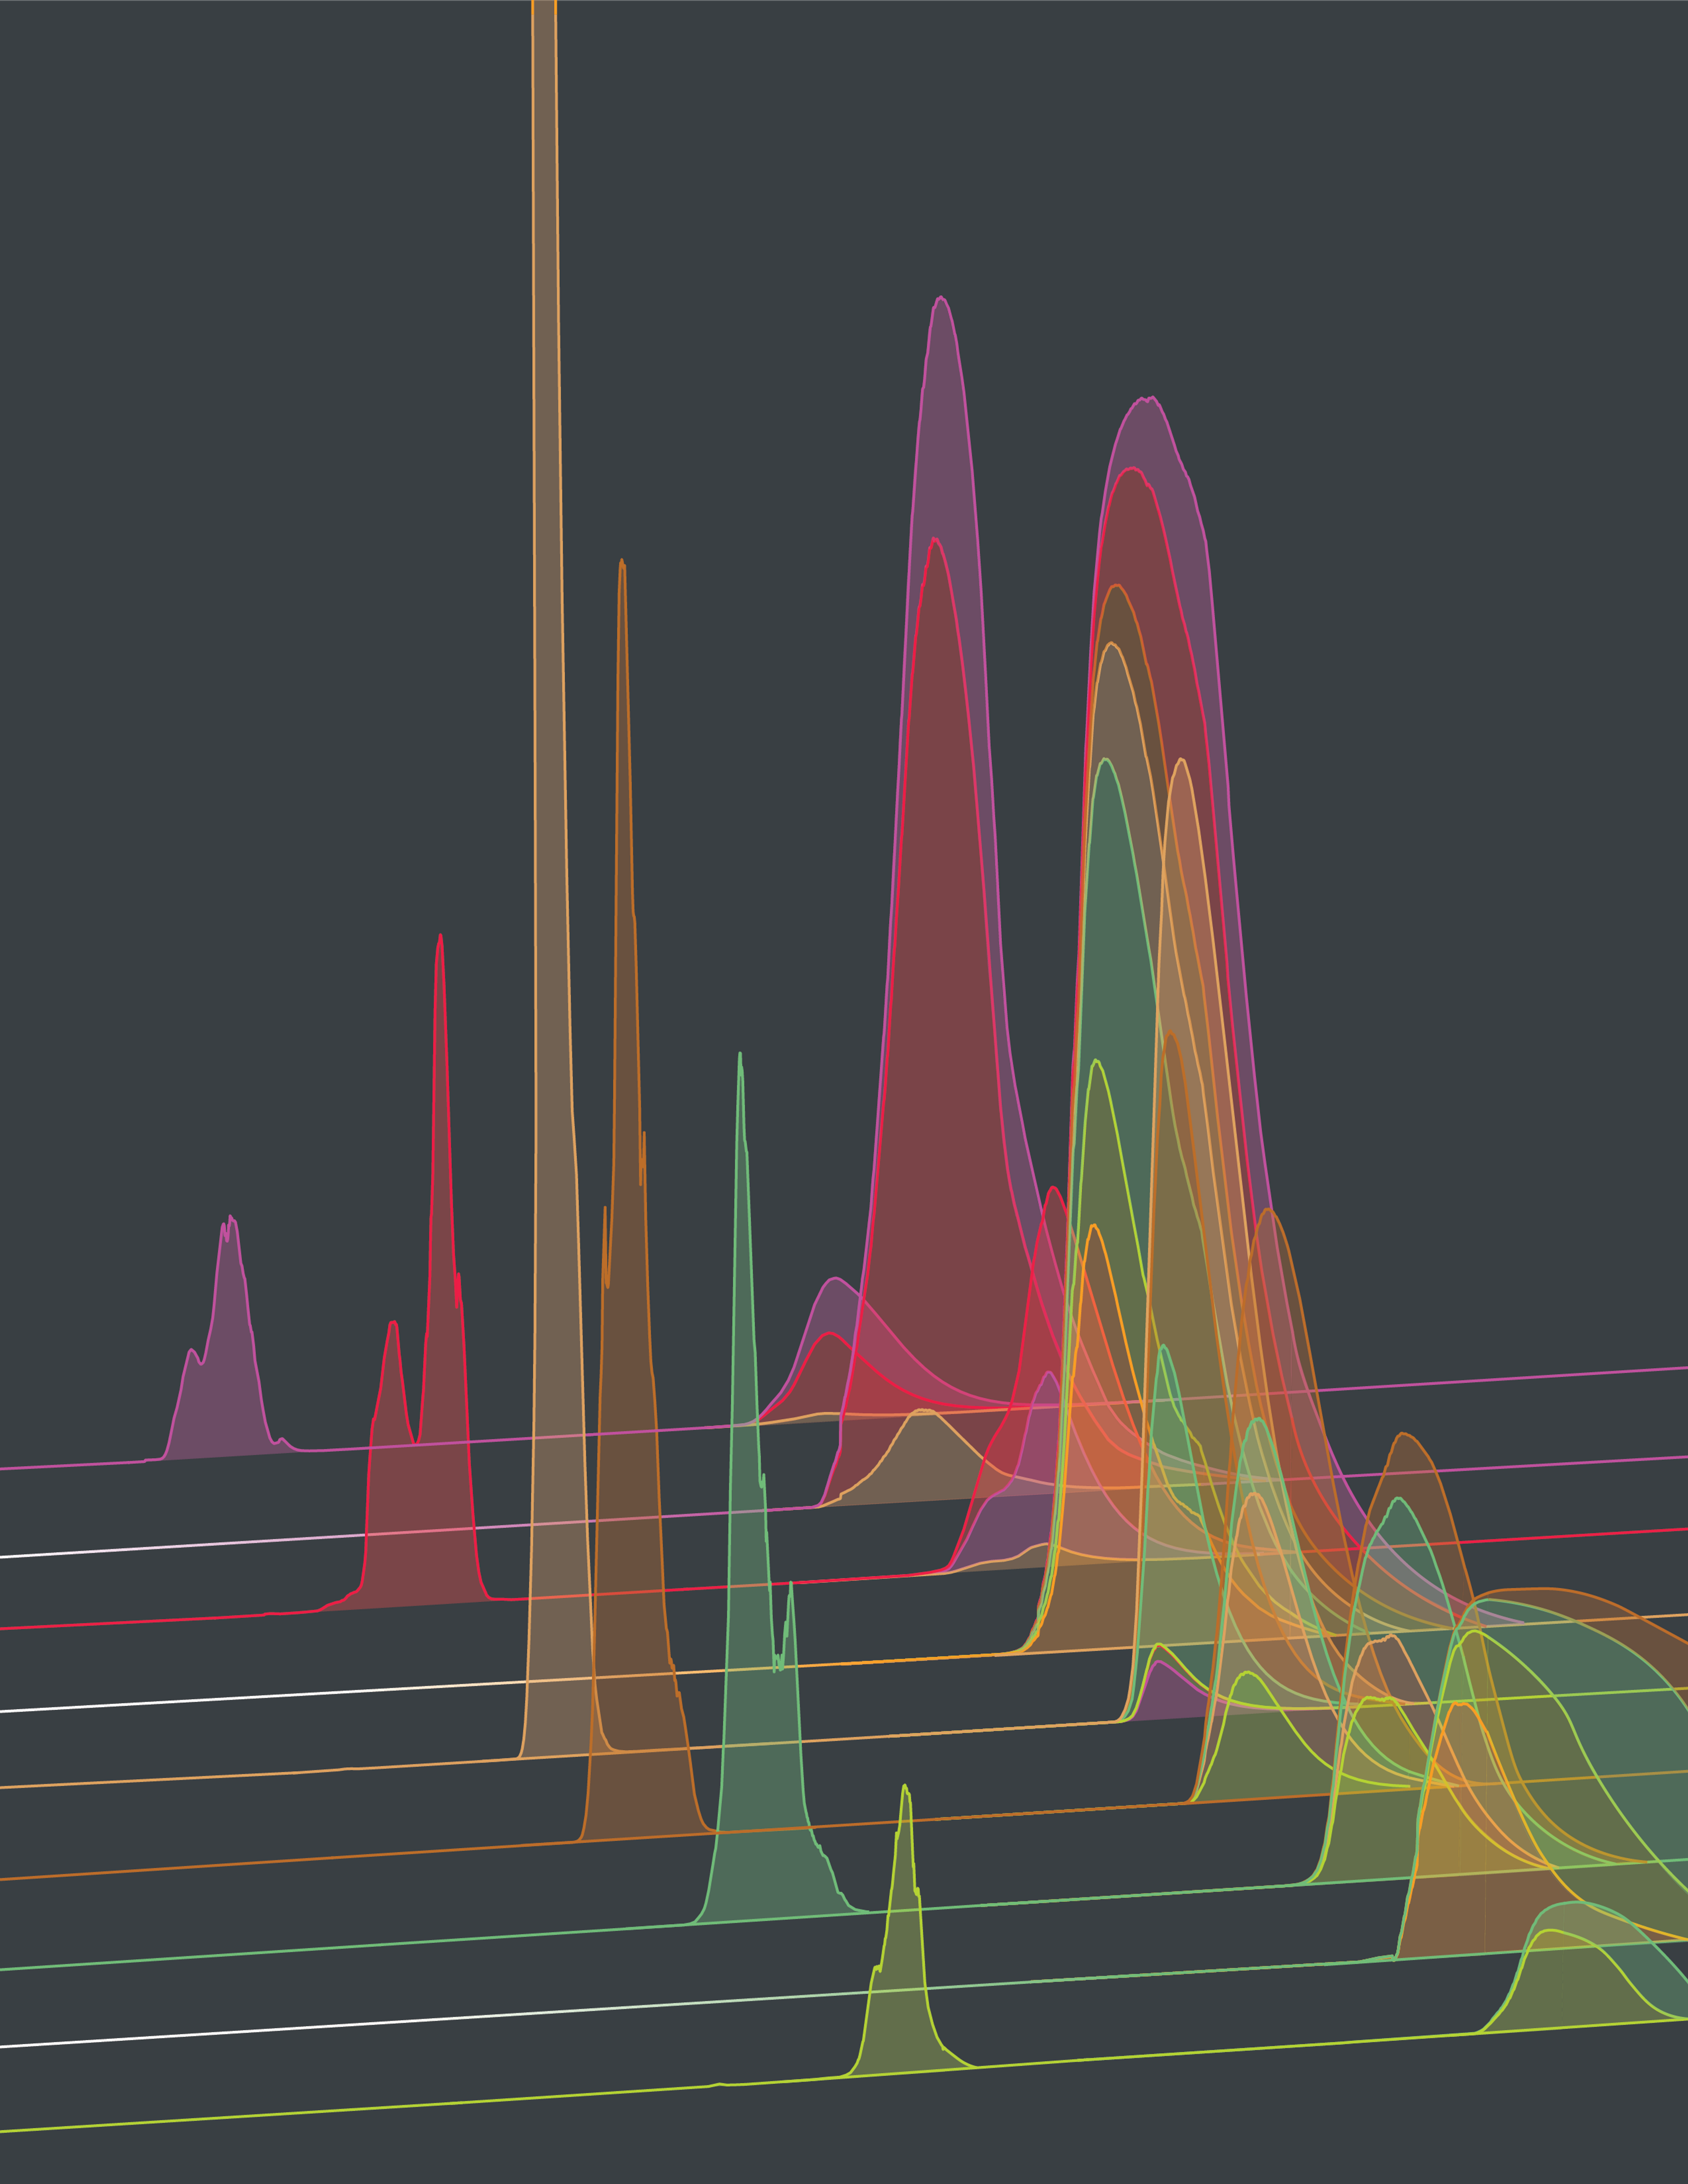
Tracking of clade frequencies. We estimate worldwide clade frequency trajectories, using sequence data counts mapped to clades together with epidemiological case data.
For frequency tracking, individual strains are assigned a smoothened population size \(N_i(t)=\exp[-(t-t_i)^2/2\sigma^2]\) and a sample frequency \(x_i^s(t) = N_i(t)/N(t)\), where \(t_i\) is the sampling time of a given strain \(i\) and \(N(t) = \sum_i N_i(t)\), with parameters \(\sigma = 33\) days (influenza) and \(\sigma = 11\) days (SARS-CoV-2). To correct for regional sampling bias, we compute reweighed strain frequencies \(x_i(t) \) by calibration with regional weekly incidence data. Next, we obtain global clade frequencies, \(X_\alpha(t) = \sum_{i\in\alpha} x_i(t)\). This procedure combines the inference of clade frequencies from sequence data with a map of the temporal epidemic pattern in each region.
Inference of antigenic evolution. We map antigenic escape evolution by curated neutralization titers of multiple test strains against multiple reference antisera.
Antigenic surveillance of influenza predominantly uses an animal model: naïve ferrets are first infected with a reference strain; then their immunity against a panel of test strains \(i\) is measured by hemagglutination-inhibition or neutralization assays, resulting in a set of neutralization titers, \(T_{ij}\) (\(i\) test strain, \(j\): reference strain). From these primary data, we form a curated, completed, and coarse-grained set of titers \(T_{\alpha\kappa}\). The curated titers depend on pairs of clades of test strains, \(\alpha\), and of reference strains, \(\kappa\), with small within-clade variation of measured titers. For pairs \((\alpha, \kappa)\) containing measured titers, \(T_{\alpha\kappa}\) is close to the average of the corresponding \(T_{ij}\). For the remaining pairs, \(T_{\alpha\kappa}\) is obtained by a tree-guided interpolation scheme that minimizes the titer variation between closely related test strains and between closely related reference strains. Strain-specific avidity and serum potency effects are taken into account by allowing titer offsets \(\Delta_i\) and \(\Delta_j\), respectively (Bedford et al., eLife 2014). For SARS-CoV-2, our analysis is based on human data. These data are treated in a similar way, with the index \(\kappa\) labeling coarse-grained infection and vaccination histories [1].
Evolution of population immunity. We track population immunity trajectories, using neutralization data and immune weights inferred from past epidemiological data.
We use a sigmoidal function to relate neutralization titers to cross-immunity, \(c_{\alpha\kappa} = H(T_{\alpha\kappa})\). Cross-immunity measures the expected reduction of susceptibility to infections by strains from clade \(\alpha\) in individuals in immunization class \(\kappa\). Full immunity (\(c_{\alpha\kappa} \approx 1\)) corresponds to high titers and full susceptibility to low titers (\(c_{\alpha\kappa} \approx 0)\). The immune weight function \(r_\kappa(t)\) gives the frequency of immune class \(\kappa\) in the human population at time \(t\); this function can be inferred from past epidemiological and clade frequency data. By combining cross-immunity and immune weights, we obtain population immunity trajectories, \(C_{\alpha\kappa}(t) = c_{\alpha\kappa} r_{\kappa}(t)\). For SARS-CoV-2, we additionally take into account immune waning by a linear reduction of neutralization titers depending on the time since infection [1].
Computation of viral fitness and predictions. We compute the relative fitness of viral clades and use this to predict the evolution of clade frequencies.
Fitness models combine the contributions from different traits relevant for viral replication (fitness components), integrating information from different types of data. An important fitness component is antigenic fitness, which describes the (negative) impact of n human immunity on viral growth. We compute the antigenic fitness of clade at time by integrating the contributions of all immune classes, \(f_{\rm{ag},\alpha}(t) = -\sum_\kappa c_{\alpha\kappa}r_\kappa(t) \). This component can also be estimated from sequence data alone, approximating titer drops by amino acid sequence divergence in antigenic epitopes, \(T_{ii} – T_{ij} \approx \sum_{r \in {\rm ep}} k_r D(a_{i,r}, a_{j,r}) \), where the index \(r \) runs over sequence positions within epitopes and \(a_{i,r}, a_{j,r} \) are the amino acids at position \(r \) for a given pair of strains \(i,j \). Intrinsic fitness effects of conserved viral functions, including stability and receptor binding, can be estimated from clade-specific mutational load in non-epitope sequence, \(f_{\rm{int},\alpha}(t) = \sum_{r \in \rm{non-ep}} k_r D (a_{i,r}, a_{*,r} ) \), where \(D (a_{i,r}, a_{*,r} ) \) is evaluated with an appropriate consensus sequence. Divergence measures depending on local sequence content can be obtained from amino acid similarity matrices (Henikoff et al., PNAS 1992; Luksza et al. Nature, 2017). The weight factors \(k_r \) can be chosen uniform in each sequence class [7]; position-specific weights can be inferred from deep mutational scanning data (Starr et al., Cell 2020; Lee et al., PNAS 2018; Doud et al., Nat Communications 2018; Cao et al., Nature 2023; [1]).
The relative fitness of a given clade is defined with respect to the mean fitness of the viral population, \(\Delta f_\alpha(t) = f_\alpha(t) - \sum_\beta f_\beta(t) X_\beta(t)\). Relative fitness serves to compute the most likely future frequency trajectory,
\[
X_\beta(t) = X_\beta(t_0) \exp \left[\int_{t_0}^t \Delta f_\alpha(t’) d t’ \right] \,
\]
starting from a prediction baseline at time \(t_0\). Conversely, tracking the recent frequency dynamics of clades serves as a cross-check for model-based fitness estimates.
[1] Meijers M., Ruchnewitz D., Eberhard J., Łuksza M., Lässig M. Population immunity predicts evolutionary trajectories of SARS-CoV-2. Cell 186, 1–14 (2023).
[2] Lässig M., Mustonen V. & Nourmohammad A. Steering and controlling evolution — from bioengineering to fighting pathogens. Nature Review Genetics (2023).
[3] Gruell H., …, Klein. F. SARS-CoV-2 Omicron sublineages exhibit distinct antibody escape patterns. Cell Host & Microbe, 30(9), 1231-1241 e1236 (2022).
[4] Gieselmann L., Kreer C., …, Klein F. Effective high-throughput isolation of fully human antibodies targeting infectious pathogens. Nature Protocols, 16(7), 3639-3671 (2021).
[5] Kreer C., …, Klein F. Longitudinal Isolation of Potent Near-Germline SARS-CoV-2-Neutralizing Antibodies from COVID-19 Patients. Cell, 182(6), 1663-1673 (2020).
[6] Lässig M., Mustonen V. & Walczak A. Predicting evolution. Nature Ecology and Evolution 1, 0077 (2017).
[7] Łuksza M., Lässig M. A predictive fitness model for influenza. Nature 507, 57–61 (2014).